Thursday, September 29, 2016

Initial Project Planning

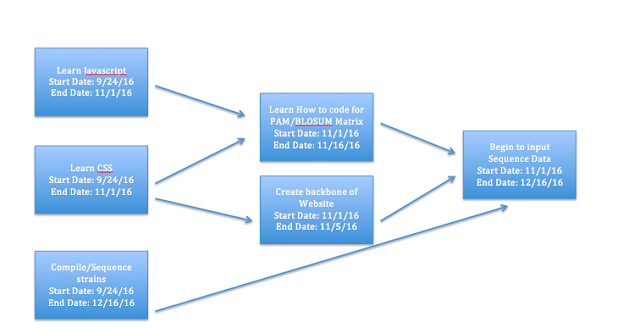
Network Diagram for the next 3 months

Updated Gantt Chart


Over the next three months I will be getting all the preliminary steps of creating a bioinformatics website out of the way. I will learn how to code in Javascript and CSS and then begin gathering the data that the website will organize. Finally, I will start the laying the foundations of the website.

Initial Project Planning:
Identify the Problem:
Lyme disease is constantly evolving and new strains are emerging. This makes it increasingly hard to treat because the strains are evolving to evade antibiotics. We need to sequence all existing strains and find which sections are increasing virulence and allowing the strains to evade the immune system and which sections are conserved.
Prior Art Survey:
There is a bioinformatics site which has compiled the sequences of 35 genomes of 8 LB species and 7 RF species. It is a manually curated site which includes comparisons of phylogeny, synteny and sequence alignments of orthologous sequences and intergenic spacers. (http://borreliabase.org/)
Literature Review: 
Can be found in previous posts.
Solution Space Exploration: 
Since a site already exists with with MSA, phylogeny and synteny. They do not have a complete genome for most strains. They also do not have the functions of each gene.
High Level Design: 
I need to get in contact with the people who wrote the paper I read over the summer about lime disease before I start my project.

Tools:
If I plan to work off of the existing database for lyme disease I will need just a computer and possibly access to the NCBI database, in order to read the articles on lyme disease strains. I could access these through the library.
If I plan to work with sequencing that have not been sequenced yet, then I will need access to a lab or some sort of collaboration with a lab to sequence the rest of the genome.
I will need a mentor who knows about the lyme disease genome

Budget:
Most likely 0$

http://www.novusbio.com/diseases/lyme-disease
http://bmcbioinformatics.biomedcentral.com/articles/10.1186/1471-2105-15-233
Bioinformatics Slide:
https://docs.google.com/presentation/d/17VzdZdIEADFSacXulYF5ocCSfWaYhgboPMJYiH3iaGA/edit?usp=sharing

Thursday, September 15, 2016

Bioinformatics Week 9

Progress on project compiled:
https://docs.google.com/presentation/d/17VzdZdIEADFSacXulYF5ocCSfWaYhgboPMJYiH3iaGA/edit?usp=sharing


Saturday, September 3, 2016

Bioinformatics Week 8

Next generation sequencing: Generates large amount of sequences. 
The price of sequencing has dropped significantly since the start of sequencing. 
454 Pyrosequecning

  • DNA is broken into smaller sequences. 
  • Attach single peice of DNA is attatched to a bead
  • Single pieces of DNA on the beads are then applified
  • Sequencing reactions occur and the sequencing data is created. 
Illumina Sequencing 
  • DNA is broken into smaller sequences 
  • Clusters of the DNA are created by adding adapters(stick together non congrous DNA)
  • Clusters are amplified in PCR
  • Then you sequence each individual cluster by adding in primers and nucleotides which are tagged with different colored florescences. 
The current sequencing technologies fall short in some aspects. First, they all break the DNA into smaller segments and then sequence them. So you are sequencing small parts and it's harder to see the bigger picture. You have to try to piece back together the small sequences to figure out what the whole piece of DNA was. When there are repetitive regions within DNA it becomes more complicated to piece back the DNA sequences once you have sequenced it. You don't know where these sequences were located on the DNA. Putting the sequences back together is called assembly. There are different programs which assemble the sequences (ABySS, SOAPdenovo, Velvet). When you are given an assembly you are also given an assembly score. This assembly score comes with the number of contigs (overlapping sequences). The fewer contigs the better. 

RNA-seq: Sequences mRNA. Can identify if alternative splicing events have occurred (removing introns, not removing introns, etc)
  • DNA is broken into smaller sequences 
  • Clusters of the DNA are created by adding adapters(stick together non congruous DNA)
  • Sequence it 
Metagenomics: Studying the sequences of microbial organism in their natural environments by just taking samples of their environment (soil, water, etc) and then you sequence it using next generation sequencing. Before you would have to remove the organism from its natural environment and then culture it in an artificial lab environment which could alter your results. 


Friday, September 2, 2016

Bioinformatics Week 7

Selection analysis: Tries to identify whether natural selection is occurring or not as well as if the selection is to get rid of a certain sequence or promote a sequence. Then how this selection affects the species. 
3 types of selection

  • Negative: Removes a detrimental mutation. 
  • Positive: Bennificial mutation promoted. 
  • Balancing/Diversfying seleciton: Favors the maintenance of multiple variations of a sequence in a diverse environment. 
When measuring selection there are two standard techniques
  • Tajima's D: Based on a few standard principles. The genetic regions near a region which is being selected for get dragged into the selection process (genetic hitchhiking). The length of the genetic region is dependent on the rate of recombination. Theta equals to Pi when no selection is occurring. When theta is greater than Pi then positive selection is occurring. When theta is less than Pi then balancing selection is occurring. Advantages: Good however can be fooled by other factors (ex:bottleneck mistaken for positive selection). Therefore after you preform Tajima's D you must preform other tests to single out chances of error in your data. 
  • dN/dS: This calculates the ratio of nonsynonmous mutations (change the protein) to synonemous mutations (doesn't affect protein). Very good for figuring out if there are specific sites which are being selected for and then figure out which codons are being selected for. No selection dN/dS=1, negative selection dN/dS<1, positive selection dN/dS>1. 
There are two popular ways of quantifying selection (measuring variation)
  • Theta: Based on the number of variable(changed between species) sites in a sample 
  • Pi: Based on the average number of differences between sequences. More sensitive to the frequency of a variation. 

Bioinformatics Week 6

Coursera Week 5: Phylogenetics
To study Phylogenetics you create visual comparisons between DNA sequences or proteins in the form of a tree. 
Mutation leads to speciation
 
There are rooted trees and unrooted trees. Rooted trees are the ones above, they expand from one point in one direction whereas unrooted trees can go off in many directions. Homeoplasy is when 2 divergent species share a similar characteristic. There are different types of homeoplasy. 
In order to conduct experiments involving phylogenetic you must have good sampling. Some of your samples need to be homologous, independent and variants of the original specimen which the tree is being based off of. Lastly, you need sequence alignments, and statistical support for their arrangement on the tree.

There are two tree building methods:
Distance methods

  • UPGMA
  • Neighbour Joining: Using blosum or PAM matrix to compare, then create a system to rate and scale the distance between the species based on their matrix score. 
  • Good things: They are computationally fast, and there is a singular best tree found in the end. 
  • Bad things: Sometimes there isn't a single best tree 

Character based (discrete) methods

  • Maximum parisomony
  • Maximum likelihood: Evaluates the likelihood of every possible mutation that could occur within a phylogenetic tree for a species to arrive at where it currently is. Then it uses statistical analysis to figure out which has the highest likelihood and assumes that's the correct tree. There are 4 base pairs so in an unbiased model there is a .25 likelihood for one of the 4 base pairs to change to another base pair. Then you multiply it to the 10th with the power of how many nucleotides there are within the sequence you are analyzing and that is the likelihood of a certain mutation. Say you have a sequence 20 base pairs long, and you can say that a certain G substitution you are studying has a .25*10^20 chance of occurring. Then after that it calculates the chances of the this change occurring over time in this fashion (process portion). Advantages: Produces clear results, you can statistically analyze the results you receive, it also gives you the other likely options that it produces. Disadvantages: It is computationally intensive and cannot be applied to large datasets. 
There is something called bootstrapping where you take all possible versions of your phylogenetic tree and then you calculate how many times certain species are grouped together. Here we see that A and B have been grouped together 100% (this number is arbitrary)  and C and D have been grouped together 75%. So it is very likely that A and B and then C and D diverge from a more recent ancestor. 70-90% the relationship is very probable. Anything less means it is a less probable relationship.